 By
·
8 minute read
By
·
8 minute read
Imagine your brand message reaching a consumer amidst 10,000 daily marketing touches. How can you ensure it stands out? The answer lies in experiential marketing.
Experiential marketing goes beyond traditional advertising by creating immersive and interactive experiences—such as test drives, concerts, contests, festivals, or culinary events—that actively engage consumers.
Unlike passive ads that are easily ignored, these hands-on activities foster genuine brand affinity and memorable connections.
Active consumer engagement captures attention and drives deeper emotional connections. However, with substantial investments comes the important question: what's the ROI of experiential marketing?
Calculating the ROI of experiential marketing has historically been challenging, but top marketers are now adopting data-driven approaches to demonstrate its value.
In this blog, you’ll learn how to set clear goals, identify key metrics, implement robust data tracking, perform accurate ROI calculations, and effectively present your findings to stakeholders.
Let’s dive into how you can accurately measure the return on investment of your experiential marketing efforts.
Why is ROI important in experiential marketing?

Whether it’s sea trials at a boat show or a pop-up booth in the subway, creating experiences involves significant resources. There’s time spent planning and executing and the financial cost of setting up, staffing and traveling products.
That means it’s no longer enough just to generate leads. You need to show how those leads impact the bottom line and win over stakeholders.
That’s done by proving positive ROI with data, which also:
- Justifies budgets
- Sets benchmarks
- Provides insights into customer preferences
- Personalizes customer journeys
- Makes the case for increased budgets
- Optimizes resource allocations
- Identifies high-performing strategies
- Improves decision making
From a broader business perspective, it also:
- Contributes to overall growth and revenue generation
- Builds trust and confidence among stakeholders
- Creates a competitive advantage that attracts future business
Why is measuring the ROI of experiential marketing so difficult?
Proving experiential ROI can be difficult, and there is a “this is how we’ve always done it” approach because there are qualitative aspects to experiential marketing that other marketing channels don’t have.
Those include:
- Building brand awareness
- Creating an emotional engagement
- Fostering customer loyalty
- Building wider brand affinity via word of mouth
There’s also more to experiential marketing than the quantifiable data points that come with digital campaigns or legacy media buys, including:
- On-site engagements
- Social media mentions and influencer campaigns
- Email and/or SMS follow-ups
- The lag time between contact and conversion
Attributing sales directly to an activation or series can make it challenging.
Step-by-step process: How to calculate the ROI of experiential marketing
By putting the right processes and tools to work, the qualitative aspects of a successful experiential activation or series become bonuses to the hard data collected, not the results themselves.
This is your five-step guide to proving experiential ROI with data.
1. Set clear goals and objectives for experiential campaigns
The most important aspect of planning a marketing activation is aligning it with broader business objectives.
It provides direction, helps allocate resources, fosters cross-functional collaboration, prioritizes where impact is needed most and makes it possible to measure that impact.
Common objectives for experiential activations include driving brand awareness, capturing quality leads, raising lead-to-sale conversion rates, gathering customer preferences, creating buzz around a new product and increasing marketing opt-ins.
For example, BMW is a brand that uses experiential marketing extensively to achieve various goals. It has about 2,000 event days annually, everything from test drive experiences to professional golf sponsorships to dealer events, all of which accomplish various objectives. Their events deliver thousands of qualified leads to dealerships, increase brand affinity, drive awareness of new vehicles and provide a clear picture of how preferences lead to conversions.

2. Identify and select key metrics for measuring ROI
The best experiential metrics fall into the SMART framework — specific, measurable, achievable, relevant, and time-bound. That means they should be well-defined, trackable, realistic, purposeful and comparable.
Depending on the larger business objectives, metrics may include attendance and participation rates, lead capture and conversion rates, social engagements, brand sentiment and awareness, hand raises and direct revenue.
Identifying which metrics are most important for measuring the success of an activation is based on the nature of the event combined with the objective. For a product launch, that can mean demo sign-ups, communication opt-ins and lead-to-conversion. A brand awareness event might include social media engagement, media coverage, and survey responses.
Metrics can also be mixed and matched. When launching a new EV model at an auto show, buzz and butts in seats could be the goals. That means tracking earned media mentions and social media tags, but also footfall and dwell time, completed test drives and leads collected.
Selecting the metrics to measure depends entirely on the goals of the larger business objective.
3. Develop a tracking and data collection plan
Just as identifying SMART metrics early in the planning process is key, so is incorporating the methods to measure them. That can mean collecting info with pen and paper or asking people to leave business cards, but top brands and agencies use technology.
This includes QR codes that drive to retail websites, badges that monitor event entry and exit, apps that drive engagement, and surveys that capture product opinions. But top brands and agencies need more than single-purpose solutions. They demand real-time data and insights to drive informed decisions.

That real-time aspect is key for many reasons. Most importantly, it connects marketing efforts and sales departments by qualifying and relaying leads immediately. It can also personalize communications and send them quickly, provide insights on activation performance, streamline activations to eliminate lines and wait times, and much more.
There are plenty of tools available for marketers to choose from. CRM systems will do some of that work, and marketing automation systems can handle repetitive tasks that bog people down. There are also providers that brands and agencies work with to accomplish these and other goals — like Limelight Platform, which powers experiences, collects real-time data, creates reports, integrates with existing tech stacks and can be customized to track any metric.
4. Calculate ROI using formulas and practical examples
Return on investment is calculated by dividing net profit (total revenue generated) by investment (total cost) and multiplying that by 100.
ROI = (net profit/investment) x 100%. The higher the result, the better.
For example, a brand runs a test drive experience at an auto show. The cost for the physical space is $250,000, set-up and tear-down are $250,000, staffing is $25,000, traveling the vehicles is $150,000, and the time spent planning, organizing and executing is calculated at $175,000. That makes the investment $850,000. By following leads from drive to conversion, the brand knows it sold 23 cars at $65,000 each for a net profit of $1,500,000.
Putting the ROI formula into action, we get: (1,500,000 / 850,000) x 100 = 176%
For every $1.00 spent, the ROI is $1.76, an excellent return on investment.
5. Analyzing and presenting ROI to stakeholders
Presenting ROI results is about knowing what’s important to the audience and using storytelling to your advantage. Providing compelling data points that speak to goals and objectives is key. Using visual aids reinforces wins and the overall narrative.
It’s important to focus on how experiential goals ladder up to broader business objectives and include KPIs used to measure success. Below is a simplified version for an experiential marketing director in the auto sector.
“The brand’s overall business objective is to drive sales of new models. That’s been the case for years, with the same three experiential marketing goals: raise brand awareness, create buzz around product launches, and capitalize on positive test drive experiences by getting quality leads to the right dealers quickly and efficiently.
Once again, this year, we accomplished all three.
To begin, social media tags and mentions were placed on the roof thanks to the very cool space we designed and the test track we used. The unveiling of the 2026 model at media day was also a huge success, garnering a ton of earned media.
By investing more year-over-year, we’ve been able to plan and build better experiences that are both more exciting and engaging.
As you can see in this visualization, the team has been steadily improving at creating revenue from our auto show experiences, with marked improvement the past two years. We broke through the 100% ROI threshold in 2024 and rocketed past it in 2025.
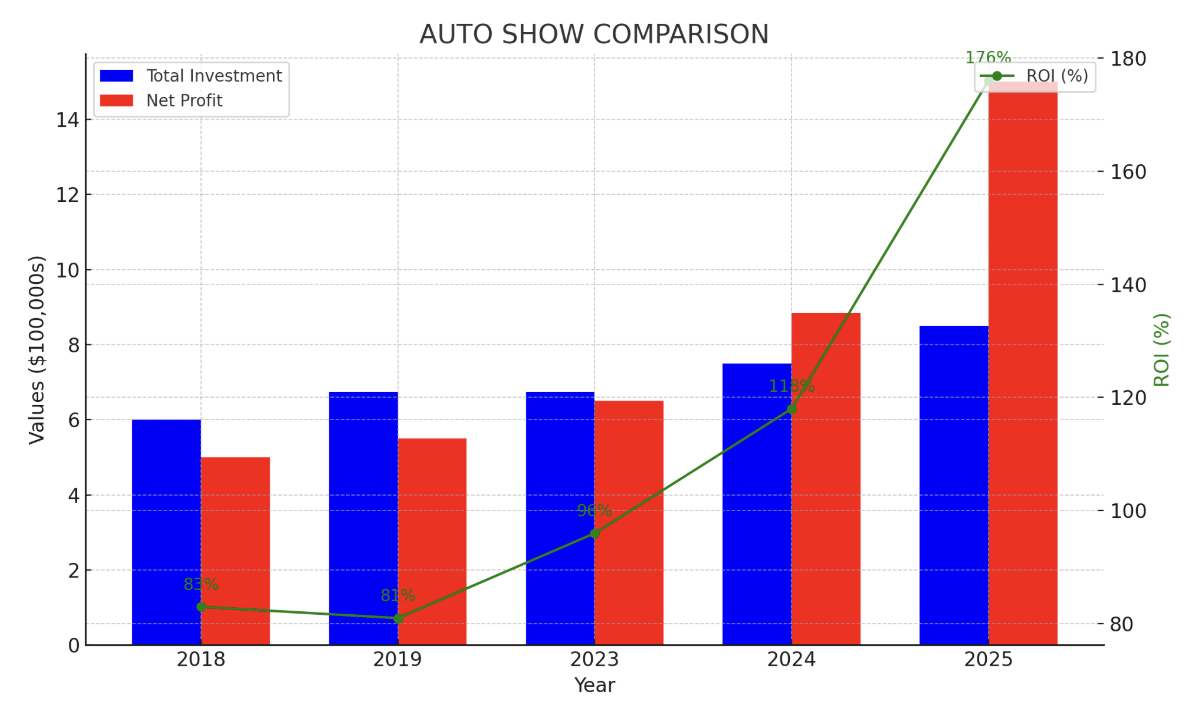
We attribute that to experience and the software solution we incorporated into our planning following COVID-19. The insights we’ve received on improving the experience have been a big help. We’re also now qualifying leads on-site and integrating them into our sales tech stack, personalizing purchase journeys and, generally, realizing overall efficiencies have made the entire operation more cost-effective.
I also have to give the corporate sales department its flowers for working with us to make the event tech the best it can be for dealers.
As you can see, this year's ROI hit 176% — every dollar spent earned $1.76. We recommend continuing to invest in experiential — auto shows and otherwise — and expanding the goals to see what else can be achieved in 2026 and beyond.”
Key metrics to measure experiential marketing
There are a lot of metrics and KPIs that tell the story of success in experiential marketing. Which ones are used depends entirely on the brand’s broader business objectives and the goals of any single marketing campaign or activation.
Like the example above, experiential marketers often have multiple goals because experiences engage consumers in multiple ways. Below are some examples of goals and metrics used to measure success.
Brand awareness
- Recall: Consumers’ ability to recall a brand when prompted
- Recognition: The ability of consumers to recognize a brand when presented with stimuli
- Media impressions: The total number of times a brand's message is seen or heard
- Social media engagement: The number of times a brand is mentioned, shared, commented on and otherwise interacted with
- Website traffic: The number of visits to a brand's website
- Share of Voice: The percentage of brand mentions compared to competitors
Recall and recognition are best measured with post-event surveys. There are various tools available to track media impressions, social engagement and share of voice, while website traffic can be tracked using Google Analytics and SERPs tools including Semrush, Ahrefs and Moz.
Customer engagement metrics
- Event Attendance: The number of people who attended an event
- Dwell Time: The average amount of time spent at an activation
- Hand raisers: The number of people who sign up for newsletters, and offers.
- Survey responses: The number of people who completed surveys and the quality of feedback
- Participation: The number of people who participated in games or contests
Event attendance and dwell time can be easily measured using spatial analysis technology, which has other benchmarking and planning benefits and doesn’t require first-party data to work well. Offline forms, surveys, games and contests that don’t require internet connections but can adapt to answers are key to on-site data collection.
Lead generation metrics
- Quantity: Total leads generated
- Quality: The quality of leads is based on criteria like household income, purchase budget, and purchase timeline.
- Conversion rate: The percentage of leads who purchase
- Cost per acquisition (CPA): The cost of acquiring a new customer
- ROI: Net profit divided by the cost of investment
- Funnel velocity: How long it takes to move leads through the sales pipeline
Customer engagement and lead gen metrics are where event software comes into play. Experiential marketers can supercharge activations by streamlining events on the front and back ends and creating a better customer experience. Capturing more data with tools such as surveys, QR codes and gamification will better inform sales departments and improve future experiences.
Sales metrics
- Revenue: The total revenue generated from an event
- Closings: The number of deals closed as a result of the event
- Average order value (AOV): The average value of each sale
- Customer lifetime value (CLTV): The total revenue a customer generates over their lifetime.
- Repeat business: The percentage of customers who make repeat purchases
With event software integrated into existing CRMs, brands can measure success in near real-time and follow customers from lead to conversion to repeat. That allows them to build profiles and further target specific groups of consumers.
Brand sentiment and advocacy metrics
- Net promoter score (NPS): A measure of customer loyalty and satisfaction
- Social media sentiment: The overall opinion derived from social media
- Online reviews: The number and ratings of reviews
- Brand mentions: The number of times a brand is mentioned in online and offline media
- Word-of-mouth marketing: Recommendations to others
Similar to brand awareness, there are several tools available to track the above. NPS is best conducted by email or online surveys. Brand24 and Hootsuite can track social sentiment and/or brand mentions, ReviewTrackers can track online reviews across multiple platforms and implementing referral programs is a great way to understand the value of word-of-mouth marketing.
Final thoughts
Traditionally, experiential marketing has been somewhat of a black box. It lacks data, especially compared to its digital and legacy media cousins. But that is no longer the case, and with modern software, it can be argued that experiential provides the most robust data results in marketing.
That means it’s never been easier to measure the ROI of experiential marketing. All it takes is a small percentage of the overall budget to put the tools and processes in place to track the right metrics.
Marketers who do that find that they can create robust reports proving the value of their work and how it helps achieve broader business objectives. They also reap insights around efficiencies, consumer demographics and tactics to reach the right people. All of these factors only strengthen the case for future investment in experiences.